The World Test Championship awards 12 points for a win, four for a draw and six for a tie. Teams are ranked not by total points but by the percentage of available points they have earned, because sides play different numbers of Tests. Slow over rates cost one point per over short.
Key takeaways
- A Test win is worth 12 points, a draw four, a tie six, and a loss nothing — regardless of series length.
- The table ranks teams by percentage of available points earned, not raw points, because the schedule is not balanced.
- Available points are 12 multiplied by the number of Tests a team has played.
- Each full over a team finishes short of the minimum over rate costs one championship point, deducted before the percentage is calculated.
- If two teams finish level on percentage, the higher share of points won in away matches breaks the tie.
What do you actually get for winning a Test?
Every Test in the championship is worth the same to both sides, no matter how long the series is or who it is against. A win, a draw and a tie each carry a fixed value, and a loss is worth nothing.
| Result | Points | Share of what was on offer |
|---|---|---|
| Win | 12 | 100% |
| Tie | 6 | 50% |
| Draw | 4 | 33% |
| Loss | 0 | 0% |
That flat structure is a deliberate change from the first championship, where a fixed pool of points was split across each series — so a win in a two-Test series was worth far more than a win in a five-Test series. Now a Test is a Test.
The practical effect is that series length no longer distorts the value of a result. Beating a side in a one-off Test earns exactly what beating them in the third Test of five does.
Why does the table rank teams by percentage instead of points?
Because teams do not play the same number of Tests. The championship has no balanced schedule — sides play different opponents, home and away, across a two-year cycle, and some play several more matches than others.
If the table ranked raw points, the team with the fullest fixture list would drift to the top simply by playing more cricket. So the standings rank by the share of available points a team has actually collected.
It also makes the table robust. A cancelled series, or a match that never gets played, does not leave a hole in the standings — it just is not counted in either half of the sum.
How is the points percentage calculated?
The ICC's competition terms set it out directly: the table ranks teams by "percentage of available points earned", and that figure is the points a team earned for wins, draws and ties, less any points deducted for penalty overs, measured against the points that were available to them.
Available points are simply 12 for every Test played, since 12 is the most any single match can yield. Written out, the whole system is one line:
Points percentage = (points earned − penalty deductions) ÷ (12 × Tests played)
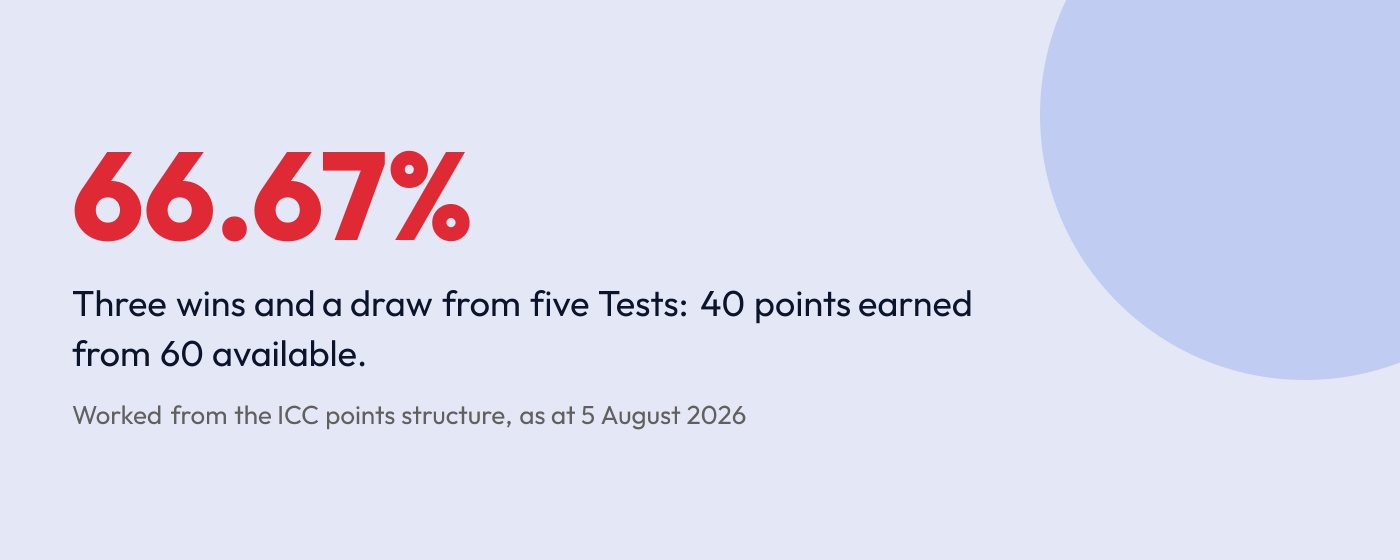
So a side that has played five Tests has had 60 points available. Win three and draw one, and it has 40 — three wins at 12, one draw at 4. That is 40 from 60, or 66.67%.
Set two teams side by side and the reason for the whole design becomes obvious:
| Team A | Team B | |
|---|---|---|
| Tests played | 10 | 4 |
| Won / drawn | 6 / 0 | 3 / 0 |
| Points earned | 72 | 36 |
| Points available | 120 | 48 |
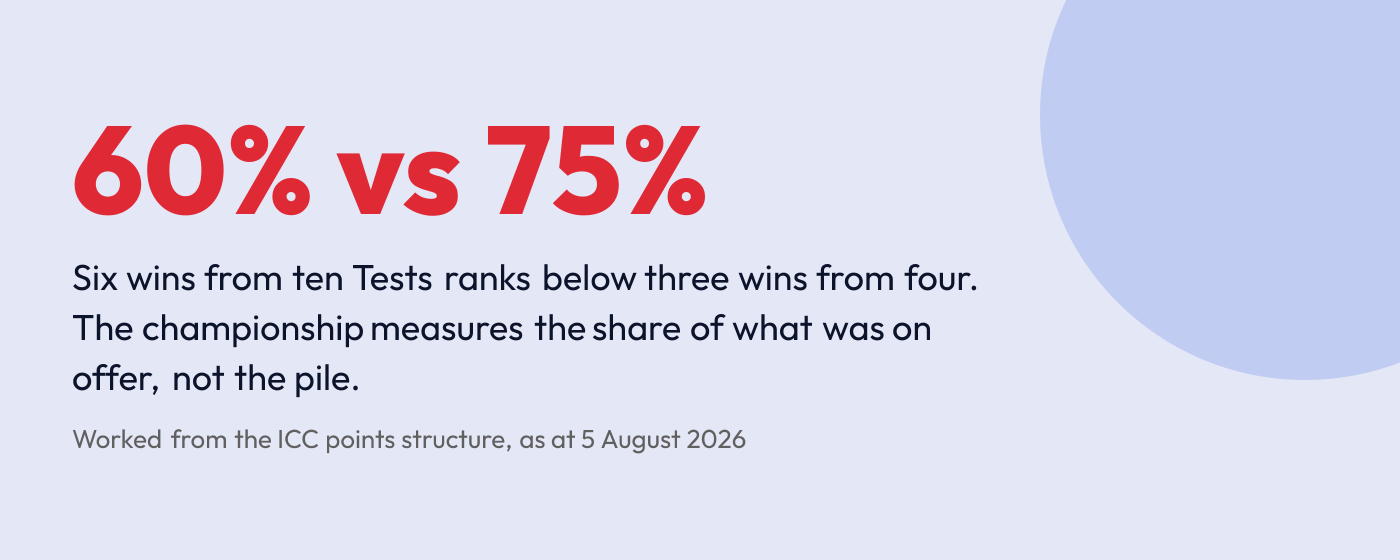
| Points percentage | 60.00% | 75.00% |
Team A has twice the points and is nowhere near the top. Team B has won fewer Tests but wasted less of what was in front of it, and that is what the championship measures.
The same team's percentage moves the instant it plays again, which is why the table reshuffles mid-series in ways that look strange until you do the arithmetic. A team sitting on a high percentage from a handful of matches has further to fall than one that has banked results across a full cycle. Nothing is banked in this competition — every new Test re-weights everything that came before it.

What happens when a team bowls its overs too slowly?
This is the part that decides cycles, and the part most people get wrong.
A team that finishes short of the minimum over rate incurs one penalty over for each full over it is short. The competition terms are unambiguous about the cost: a team "will have one (1) point deducted from its points total for each Penalty Over it incurs during the Round Stage."
One point per over short. Not two — that was the older rule, and it is still widely misquoted.
The deduction is applied before the percentage is worked out, so it does not just cost points, it drags the whole ratio down. A side with 60 points from six Tests sits at 83.33%. Dock two points for slow over rates and it is 58 from 72 — 80.56%. Two overs, nearly three percentage points.
Over a two-year cycle those fractions compound, and they have separated teams who were otherwise level on results.

How do teams reach the final?
The two teams at the top of the table at the end of the round stage contest the final. There is no semi-final and no play-off — the league table is the qualification.
That is why the percentage matters so much more than it looks. Teams are not chasing a points total; they are defending a ratio against every match they still have to play. Losing a dead rubber at the end of a cycle can cost a place in the final, because it adds 12 to the denominator and nothing to the numerator.
What happens if two teams finish level?
If two or more sides end the round stage on an identical points percentage, the tie is broken by their record away from home — specifically, the higher percentage of available points each earned in their away matches, which the terms call the "Away Points Percentage".
It is a sensible tie-break for a competition with no balanced schedule. Winning away is the harder thing to do, so the side that did more of it goes through.
What does this system reward that a points table would not?
Three things, and they are all deliberate.
- Consistency over accumulation. Because the denominator grows with every Test, a team cannot bank a strong start and coast. A run of draws quietly erodes a percentage even while it adds points to the total.
- Discipline. Over-rate deductions are the only way a side loses ground without being beaten, and they punish exactly the behaviour the format struggles with — slow, attritional cricket that shortens the day.
- Away performance. It only surfaces in the tie-break, but it shapes how teams approach tours. Under a raw points system a draw away and a draw at home are identical; here, level teams are separated by who did their work in unfamiliar conditions.
What do people most often get wrong about it?
Two things, repeatedly.
- That the leader is the team with the most points. The standings are ordered by percentage, so a side with fewer points can and frequently does sit above one with more.
- That over-rate penalties cost two points. That was the earlier rule. Under the current competition terms it is one point per over short — still enough to decide a cycle, but half what most people quote.
How should you read the table mid-cycle?
Three habits make the standings far more legible:
- Look at matches played, not just position. A team at the top having played four Tests and a team at the top having played fourteen are in very different situations.
- Check for deductions. A percentage that looks oddly low for a team's results usually means over-rate penalties.
- Count the fixtures left. Percentage is a moving average — what a team can still reach matters more than where it sits today.
You can follow the fixtures that feed the table on our match schedule, track the series in progress on the series and tournaments page, and see how the same teams sit in the conventional formats on the ICC rankings page.
The championship's design rewards a specific kind of team: one that wins away, keeps its over rates honest, and does not treat any Test as a dead rubber. That is a harder standard than a simple points table, and it is the whole point of it.
Frequently asked questions
Twelve points. A draw is worth four and a tie six, while a loss earns nothing. Every Test carries the same value regardless of how many matches are in the series, which is a change from the first championship cycle where a fixed pool of points was divided across each series.
Because teams do not play the same number of Tests. The championship has no balanced schedule, so ranking by raw points would favour whoever played the most cricket. Ranking by the share of available points earned lets sides be compared fairly at any moment, and means a cancelled series does not distort the standings.
Take the points earned from wins, draws and ties, subtract any points deducted for penalty overs, then divide by the points that were available — 12 for every Test played. A team with 40 points from five Tests has earned 40 of a possible 60, which is 66.67 per cent.
One championship point for each full over a team finishes short of the minimum over rate. The deduction is applied to the points total before the percentage is calculated, so it lowers the ratio as well as the raw score. An older rule deducted two points per over, which is still often misquoted.
The two teams at the top of the standings when the round stage ends. There is no semi-final or play-off stage — the league table decides the finalists outright, which is why every result in the cycle carries weight, including matches in an already-decided series.
The tie is broken by away record. The team with the higher percentage of available points earned in its away matches — the Away Points Percentage — is ranked ahead. It rewards the harder achievement in a competition where teams face different opponents in different conditions.
Sources
Statistics in this article were checked as at 5 August 2026.