ICC player rankings are not career averages. Each performance is scored from the scorecard, weighted for match conditions and the strength of the opposition, then folded into a moving average on a 0 to 1000 scale that emphasises recent matches. A career average counts every run equally, forever. The two orders therefore differ.
Key takeaways
- ICC player ratings run on a scale of 0 to 1000, where 750 or more is normally enough for a place in the world top ten and anything above 900 is described by the ICC as a supreme achievement.
- Travis Head led the ICC men’s Test batting rankings on 853 points as at 12 August 2026, with a career Test average of 43.28 — lower than eight of the nine batters ranked below him.
- Babar Azam returned to the Test top ten on 12 August 2026, rising five places to 10th on 716 points after scores of 88 and 24 not out.
- Ratings decay while a player is inactive, and a player must appear within the qualifying period — 12 to 15 months in Tests — to stay ranked at all.
- All ICC rankings receive an annual update around 1 May, which can move a player or a team that has not played in between.
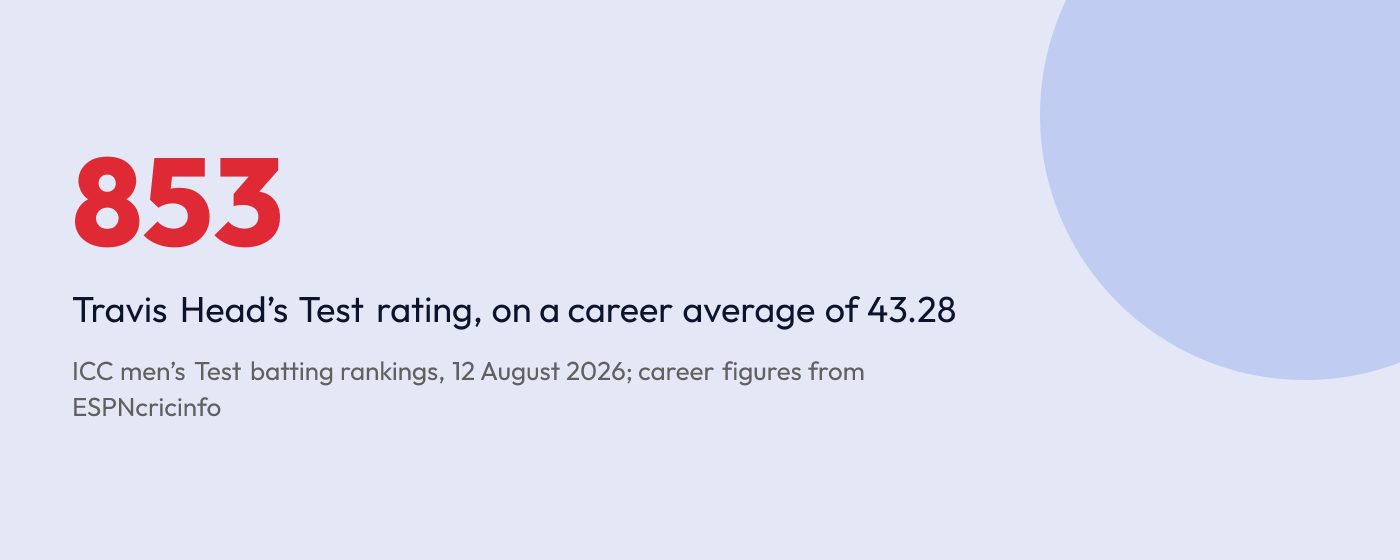
The ICC prints a number next to every leading batter's name, and it is not the number most supporters carry in their heads. As at the ICC's update of 12 August 2026, Travis Head sat top of the men's Test batting rankings on 853 rating points. His career Test average is 43.28 — lower than eight of the nine batters ranked below him.
That is not a fault in the table. The rankings and the averages measure two different things, and knowing which is which changes how you read every rankings story that lands on the cricket news feed.
What do the ICC player rankings actually measure?
A career average is simple arithmetic: runs scored divided by the number of times a batter has been dismissed. It treats a hundred made in 2013 exactly like a hundred made last week, and it does not care who was bowling or what the pitch was doing.
An ICC rating does care. The ICC describes its player rankings as a points system on a scale of 0 to 1000, produced by a pre-programmed algorithm with no human intervention and no subjective assessment. Every rated performance is scored from the information on the scorecard, then folded into what the ICC calls a sophisticated moving average.
Three things feed the value the algorithm puts on an innings:
- The runs themselves, in the context of that match.
- The conditions, read from the scorecard. If both sides post big totals, run-scoring is treated as relatively easy and the innings is marked down. If both sides are bowled out cheaply, runs are at a premium and the same score is worth more.
- The strength of the opposition, so runs against a top-ranked attack are worth more than the same runs against a side near the foot of the table.
The ICC's own benchmarks give the scale meaning. A rating above 500 is described as good and solid, 750-plus is normally enough for a place in the world top ten, and anything over 900 is called a supreme achievement.
Why is the No. 1 Test batter not the one with the best average?
Set the ratings alongside career averages and the disagreement is plain. Ratings below are the ICC men's Test batting list as at 12 August 2026; career figures are each player's full Test record from ESPNcricinfo's Statsguru, checked on 17 August 2026.
| # | Batter | Rating | Tests | Career average |
|---|---|---|---|---|
| 1 | Travis Head (AUS) | 853 | 66 | 43.28 |
| 2 | Harry Brook (ENG) | 852 | 38 | 53.04 |
| 3 | Joe Root (ENG) | 840 | 166 | 50.58 |
| 4 | Steve Smith (AUS) | 831 | 124 | 56.07 |
| 5 | Temba Bavuma (SA) | 775 | 66 | 38.10 |
| 6 | Kamindu Mendis (SL) | 744 | 17 | 58.12 |
| 7 | Shubman Gill (IND) | 743 | 42 | 43.89 |
| 8 | Rachin Ravindra (NZ) | 740 | 24 | 47.82 |
| 9 | Yashasvi Jaiswal (IND) | 733 | 30 | 48.43 |
| 10 | Babar Azam (PAK) | 716 | 64 | 43.68 |
Sort that table by average and it reorders almost completely. Kamindu Mendis averages 58.12 and is sixth. Steve Smith averages 56.07 and is fourth. Temba Bavuma averages 38.10, the lowest of the ten, and is fifth.
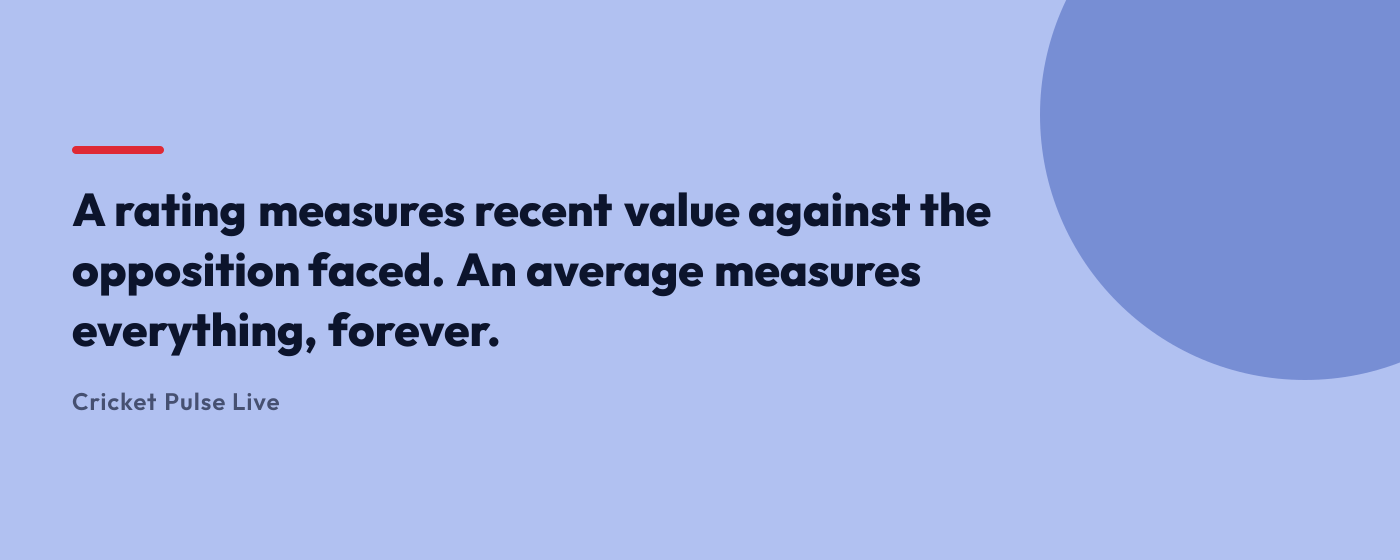
None of that makes the rankings wrong. It makes them recent. The ICC says its ratings take a player's entire career into account but put more emphasis on what that player has done lately, which is why a batter in the middle of a heavy run of scoring can sit above one whose average was assembled over a decade.
Career length pulls the other way as well. Kamindu Mendis has played 17 Tests; Joe Root has played 166. A moving average has far less to work with across 17 matches, and the ICC notes it can take a player several matches simply to break into the published list of the top 100.
What put Babar Azam back in the top 10?
Babar Azam's return is a clean illustration of how quickly the number moves. He climbed five places to 10th, on 716 points, after scores of 88 and 24 not out. It was his first appearance inside the Test top ten since the start of September 2024, and some way short of the career-best second place he held during Pakistan's home series against England in December 2022.
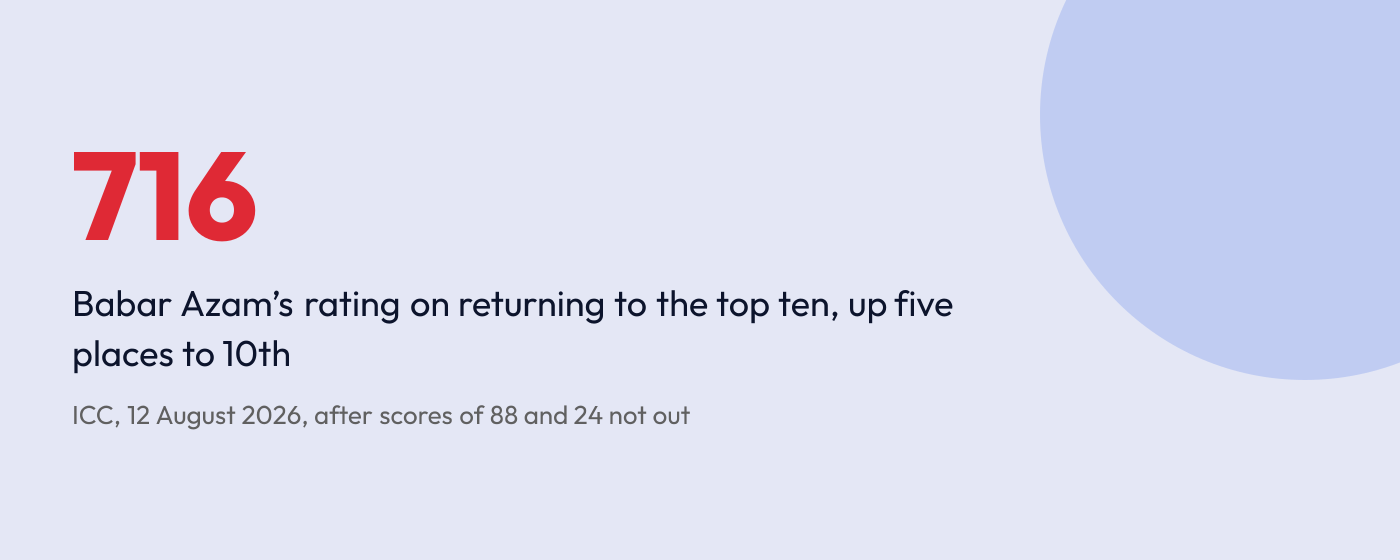
His career average across 64 Tests is 43.68 — fractionally higher than the batter at No. 1. Those two innings barely shifted the average. They moved the rating five places.

Pakistan's other movers in the same update show the same sensitivity. Abdullah Shafique climbed 25 places to 32nd after an unbeaten 160, and Sajid Khan rose five places to 30th among Test bowlers. Ravindra Jadeja stayed top of the Test all-rounder list — an index the ICC builds by multiplying a player's batting and bowling points together and dividing by 1000, where anything above 300 is regarded as world class.
Why does the opposition matter so much?
The same weighting runs through the team rankings, a system developed by David Kendix covering men's Test, ODI and T20I cricket and women's ODI and T20I cricket. A team's rating is its points divided by its match or series total. The ICC compares the result to a batting average, with points standing in for runs and matches standing in for dismissals.
Because opposition strength is priced in, an away win over a strong side is worth far more than a home win over a weak one. Bangladesh's first Test victory in Australia, completed in Darwin on 16 August 2026, is precisely the sort of result the system is built to reward.
Australia 198 and 284; Bangladesh 426 and 57 for 1. Bangladesh won by nine wickets. Hasan Mahmud took 6 for 55 and was named player of the match; Mehidy Hasan Miraz took a five-wicket haul in the second innings.
Bangladesh moved to fourth in the World Test Championship standings on 66.67 percentage points on the back of that win. The rankings and the WTC table are separate systems, and it is worth keeping them apart: the WTC counts the percentage of available points a side has won inside a defined cycle, while the team rankings run continuously and weight who you beat. You can follow both against the fixtures on the ICC rankings page and in live scores.
What happens to a rating when a player stops playing?
It falls, slowly. The ICC's own worked example is MS Dhoni, who kept a rating that diminished gradually as he missed matches after stepping down from Test cricket in 2014.
The rules around inactivity explain a good deal of movement that has nothing to do with form:
- A batter who does not bat has their rating left unchanged. A bowler is only penalised for not bowling if the opposition passed 150.
- A player must appear within the qualifying period to stay ranked: 12 to 15 months in Tests, 9 to 12 months in ODIs and T20Is.
- Only the top 100 players in each list are published.
- All rankings receive an annual update around 1 May, which can move a player or a team that has not played a ball in between.
That last rule is the one that catches people out. A side can wake up in May a place lower without having lost anything.
How should you read a ranking next to a scorecard?
Treat the two numbers as answers to different questions. A career average answers how good a player has been across everything they have done. A rating answers how much that player has been worth lately, against this standard of opposition, in these conditions.
Neither is the whole picture, and the honest reading is usually both at once. A high rating on a modest average, as with Head, says a batter is scoring runs that matter now. A high average on a modest rating, as with Kamindu Mendis, says the body of work is excellent and the sample is still small.
One practical habit is worth more than any of the maths: check the date. A rankings table with no date attached cannot be used. Every figure here is as at 17 August 2026, drawn from the ICC's update of 12 August 2026, and the Test cricket played since then will already have moved some of it. Check the match schedule for what is next in the cycle, because the next series is what the ratings are about to price in.
Frequently asked questions
No. An average divides runs by dismissals and treats every innings alike. An ICC rating scores each performance from the scorecard, adjusting for how easy run-scoring was in that match and for the strength of the opposition, then folds it into a moving average weighted towards recent matches. The two measures often place the same players in a different order.
The ICC gives three benchmarks on its 0 to 1000 scale. A rating above 500 is good and solid. A rating of 750 or more is normally enough for a place in the world top ten of that format. Anything above 900 is described as a supreme achievement, and very few players reach it in a career.
Ratings diminish gradually while a player is inactive, so a place can be lost with no innings played. A player also drops off the published list entirely if they do not appear within the qualifying period, which is 12 to 15 months for Tests and 9 to 12 months for ODIs and T20Is. All rankings additionally get an annual update around 1 May.
The all-rounder index is built from the two individual ratings a player already holds. The ICC multiplies a player’s batting points by their bowling points and divides the result by 1000. An index above 300 is regarded as world class. Ravindra Jadeja held the top place among Test all-rounders as at 12 August 2026.
No, they are separate systems. The WTC table counts the percentage of available points a side has won inside a defined championship cycle. The ICC team rankings run continuously, divide points by the match or series total, and weight results by the strength of the opposition, so an away win over a strong side is worth considerably more.
Sources
- About ICC Rankings — how team and player rankings are calculated
- ICC Rankings FAQs
- Babar back inside top 10 as Pakistan trio win rankings boost
- Babar back in top 10 of ICC Men’s Test batting rankings (media release)
- Bangladesh notch historic first Test win in Australia
- ICC Test rankings: Babar Azam returns to the top 10 — full top-10 table
- Babar Azam returns to ICC Test batting top 10 rankings after two years
- Travis Head — Test batting career record (Statsguru)
- Harry Brook — Test batting career record (Statsguru)
- Joe Root — Test batting career record (Statsguru)
- Steve Smith — Test batting career record (Statsguru)
- Temba Bavuma — Test batting career record (Statsguru)
- Kamindu Mendis — Test batting career record (Statsguru)
- Shubman Gill — Test batting career record (Statsguru)
- Rachin Ravindra — Test batting career record (Statsguru)
- Yashasvi Jaiswal — Test batting career record (Statsguru)
- Babar Azam — Test batting career record (Statsguru)
Statistics in this article were checked as at 17 August 2026.